Lean Management KPI
The success of lean manufacturing can be measured by using specific key performance indicators. These provide insights into the performance and efficiency of your production processes.
In this blog article, I will introduce you to the most important key performance indicators in the field of lean management and explain how you can apply them in your company.
This blog article presents lean metrics from two different areas:
- KPI´s in the environment of lean manufacturing / production
- KPI´s in the field of lean development / project management
Why do we need lean KPI´s?
Lean Management strives to boost customer value by improving efficiencies and reducing waste across operations.
To achieve operational success through smart lean decisions, companies must learn how to use and implement Lean-Focused KPI.
Result KPI´s or Steering KPI´s?
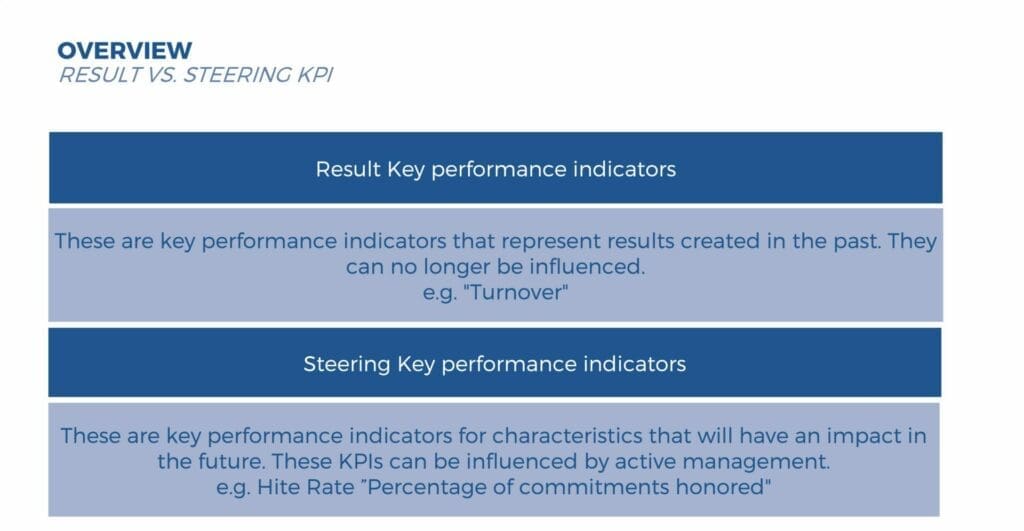
When we deal with key figures, we should distinguish between two categories of key figures: Result KPI´s and Steering KPI´s.
Result KPI are KPI´s that represent results that lie in the past and can no longer be influenced. The key figure turnover/month, for example, is such a KPI. The KPI measures how many products were sold in the last month. As a user, I can no longer change the sales of products in the last month.
Steering KPI are KPI that show characteristics that will have an effect in the future. The effects of these key figures can be influenced by active management. For example, the KPI Hitrate or Percentage of commitments kept” is a controlling key figure. It shows how many commitments a team has kept in relation to all commitments that week. If the number of commitments in the team drops, this is a strong indication that the team is overloaded or that something else (e.g. processes) is not right in this team. As a manager, a drop in this KPI is a warning. I can now take action (“steer”) and support the team.
The most important KPI´s in the lean manufacturing

We will now first look at key figures from the lean manufacturing / production environment. These are key figures that are typically used in the context of industrial production.
Making processes more efficient
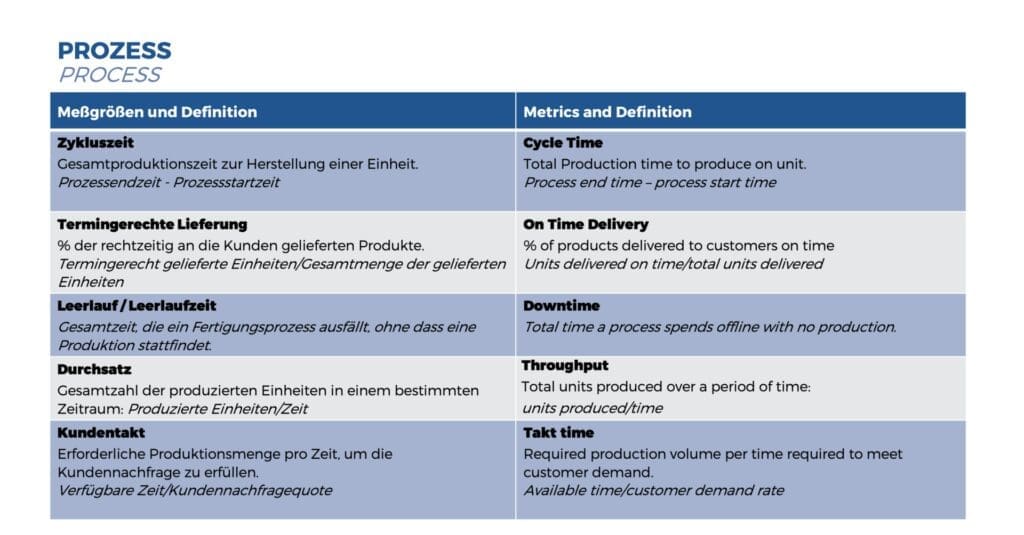
The cycle time measures the total time it takes to produce a unit. A short cycle time means that products can be manufactured and delivered quickly, resulting in high customer satisfaction.
Delivery On-Time indicates the percentage of products delivered to customers on time. A high rate shows that your company is reliable and meets customer requirements. Calculation: Units delivered on time / total units delivered.
The total down time during which a manufacturing process is down without production taking place is called idle time, or idle time for short. Minimizing idle time increases productivity and reduces costs.
Throughput is the total number of units produced in a given period of time. If the throughput is higher, the production capacities are used more efficiently
The tact time is the production volume per time required to meet customer demand. It is calculated by dividing the available time by the customer demand rate. The tact time helps you to adapt your production processes to customer requirements.
Increasing efficiency
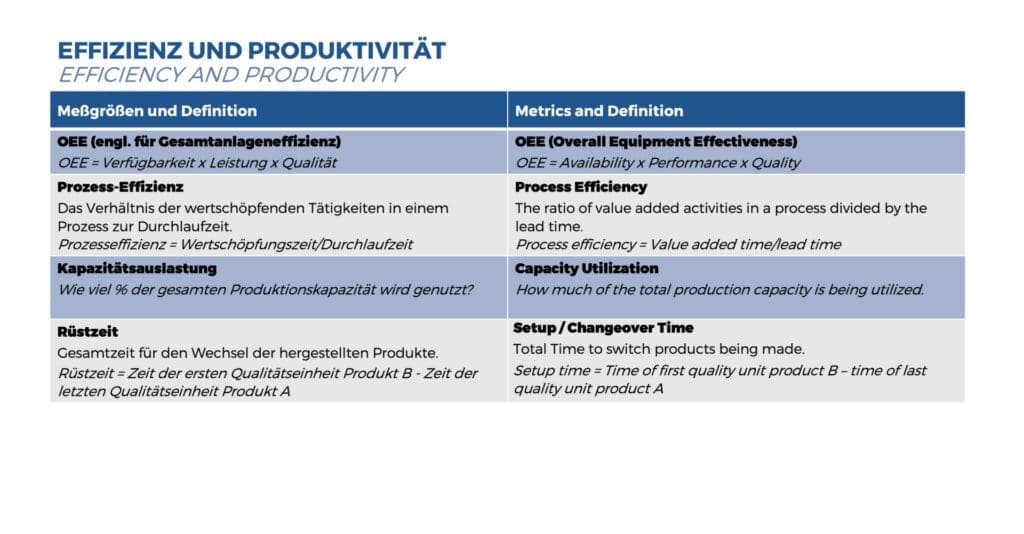
The key figure OEE is named after the abbreviation of the English term Overall Equipment Effectiveness. Overall equipment effectiveness measures the productivity of the equipment and is calculated as availability x performance x quality. A high OEE value shows that your machines are working efficiently and reliably.
You measure the ratio of value-adding activities in a process with the key figure process efficiency. It is calculated as the value added time divided by the lead time. High process efficiency means that your production processes are optimally organized.
Capacity utilization shows you how much of the total capacity is being used by production. If this value is high, this indicates good planning and utilization of resources.
Maximize productivity
Shorter Change-Over times increase the flexibility and responsiveness of production. The change over time is calculated from the time of the first quality unit product B minus the time of the last quality unit product A. It is therefore the total time for changing the manufactured products.
Maintaining financial control
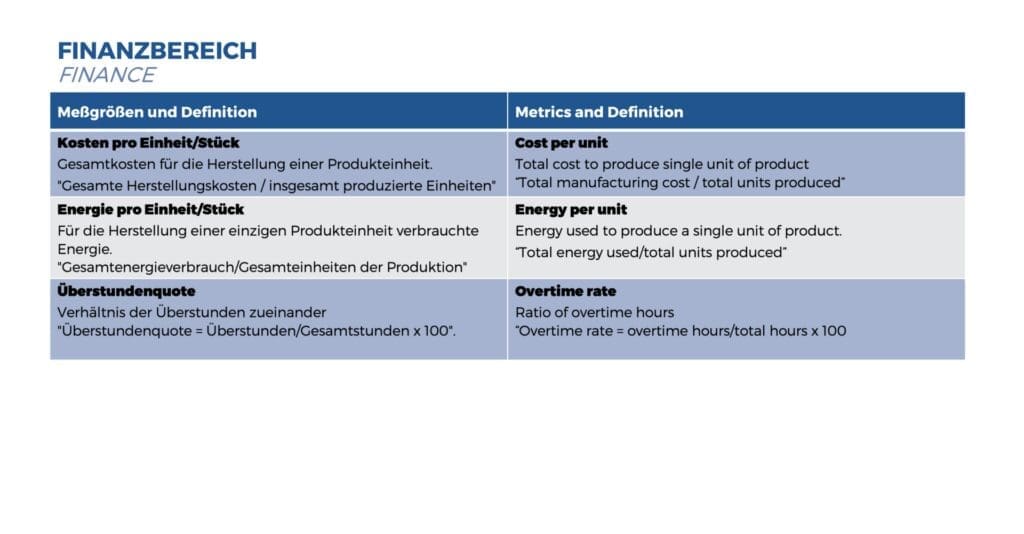
The cost per unit key performance indicator keeps an eye on the total cost of manufacturing a product unit. Lower costs per unit lead to higher profit margins.
The energy used to manufacture a product unit is measured using the energy per unit key performance indicator. Efficient energy consumption reduces production costs and protects the environment.
The ratio of overtime to total working hours is the overtime rate. A low overtime rate shows that working time is being used efficiently.
Optimize inventory management
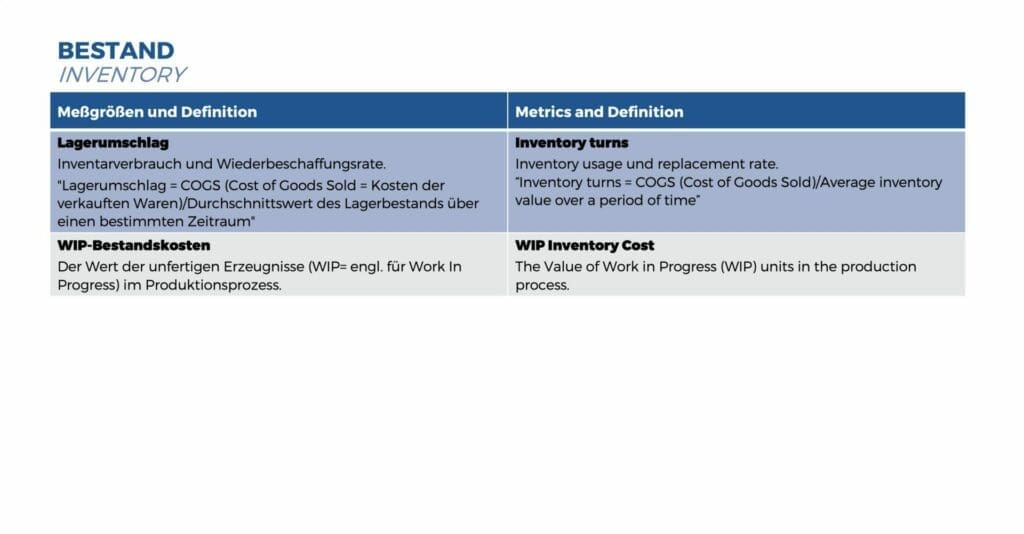
The inventory turnover is the inventory consumption and the replenishment rate. A higher inventory turnover rate indicates efficient inventory management and lower storage costs. Calculation: Inventory turnover = COGS (cost of goods sold) / average value of inventory over a certain period of time
WIP inventory costs are defined as the value of work in progress in the production process. Low WIP inventory costs indicate a fluid production process.
Ensuring quality
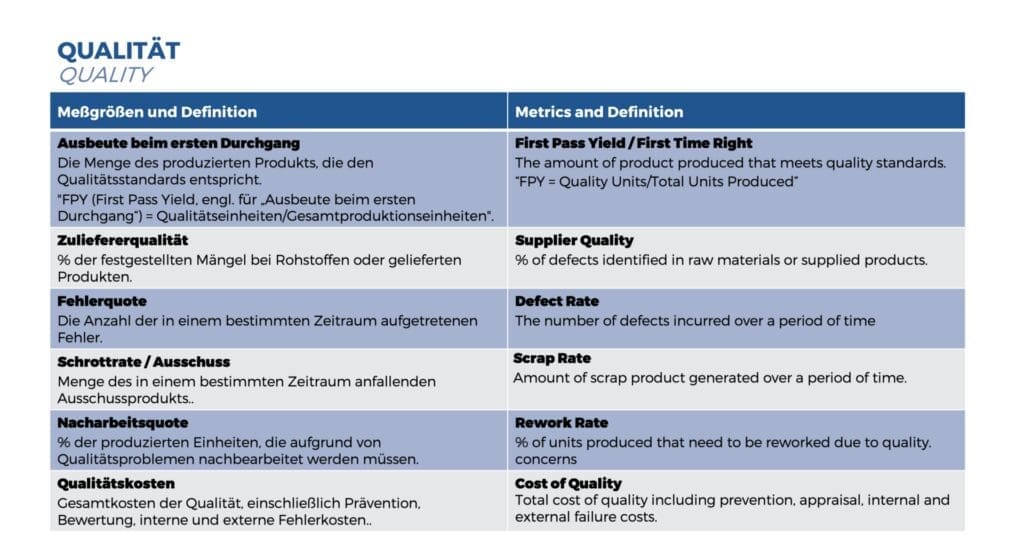
The first pass yield is the quantity of product produced that meets quality standards right away. This is also known as First Pass Yield (FPY) or First Time Right (FTR). Calculate this value as the proportion of perfect quality units in the total units produced. A high FPY rate reduces rework and rejects.
A high supplier quality ensures the quality of the end products. The key figure looks at the percentage of defects found in raw materials or delivered products.
A low defect rate improves product quality and customer satisfaction and is defined as the number of defects occurring in a given period.
The scrap rate, also known as rejects, is the amount of scrap product produced in a given period. A low scrap rate reduces your production costs and thus increases efficiency.
In production, you aim for a low rework rate. The percentage of units produced that have to be reworked due to quality problems should be as low as possible. Low rework rates indicate high process stability and product quality.
The total cost of quality also includes prevention, evaluation and internal and external defect costs. Low quality costs increase profitability and competitiveness.

Contact us now!
We have more than 20 years of experience and deliver high quality consulting for your Agile, Lean or Digital Transformation.
The most important KPI´s in project management

We will now take a look at key figures from the lean development / project management environment. These are key figures that are typically used in the context of project management in indirect areas such as R&D.
In project management, key performance indicators are essential for monitoring and controlling the progress, efficiency and quality of a project. We present the most important KPIs and explain how they can be used to optimize project management.
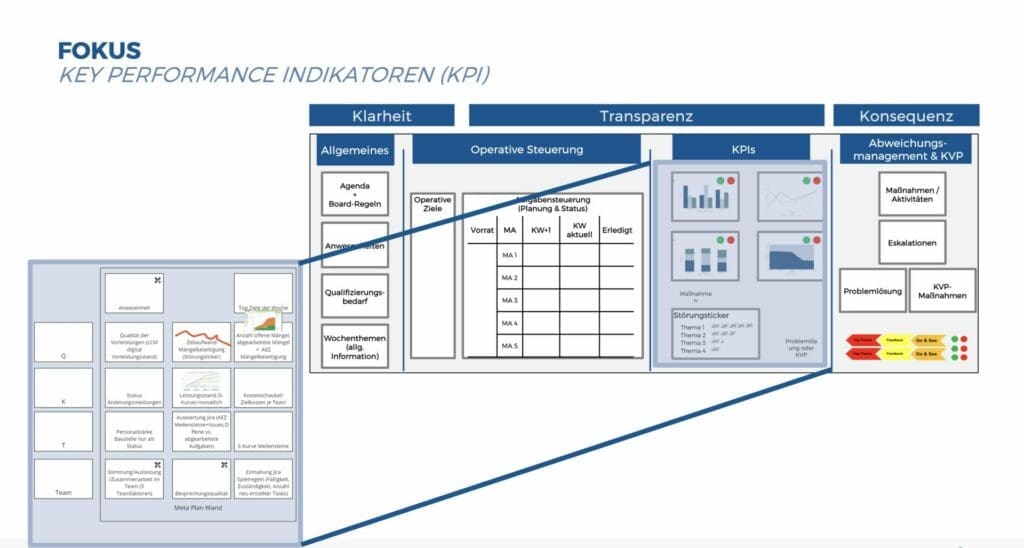
KPI´s in the project environment and indirect area differ in that we are essentially dealing with invisible value creation. Value creation takes place in the minds of employees or in places that are not on sight / in sight.
This value creation needs to be visualized using digital or physical team boards. This enables the team and managers to recognize deviations at an early stage and take countermeasures.
You will often find the following KPIs on such team boards in the indirect area or in the project environment.
The most important KPI´s in project management
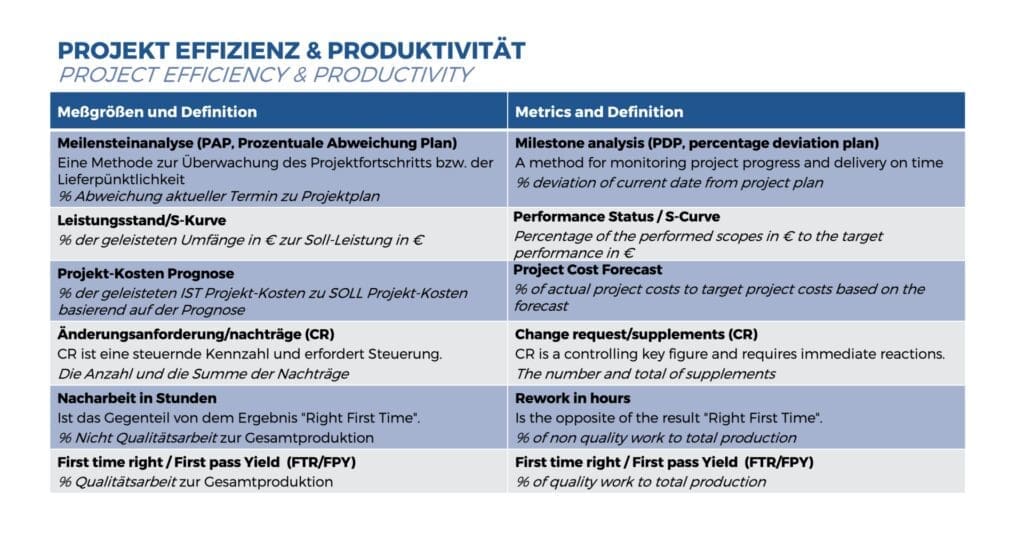
Milestone analysis, also known as Percentage Plan Deviation (PPD), is a method for monitoring project progress and on-time delivery. It measures the percentage deviation of the current schedule from the original project plan. This KPI helps identify delays early and take corrective actions.
The performance status, represented as an S-curve, shows the project’s progress in financial terms. It calculates the percentage of completed tasks in € relative to the planned performance in €. This visualization helps assess actual progress compared to the plan.
The Project Cost Forecast compares the actual project costs incurred with the planned costs based on the forecast. It shows how well the project is staying within budget and allows for early identification of financial risks.
Change requests (CR) are controlling KPIs that require active management. They include the number and total of change orders. This KPI is important for monitoring the impact of changes on the project budget and schedule.
Rework measured in hours is the opposite of “Right First Time”. It indicates the percentage of non-quality work relative to total production. High rework times suggest quality issues that need to be addressed.
The KPI First Time Right / First Pass Yield (FTR/FPY) measures the percentage of quality work relative to total production. A high FTR/FPY value indicates that most work is done correctly the first time, reflecting efficient processes and high-quality standards.
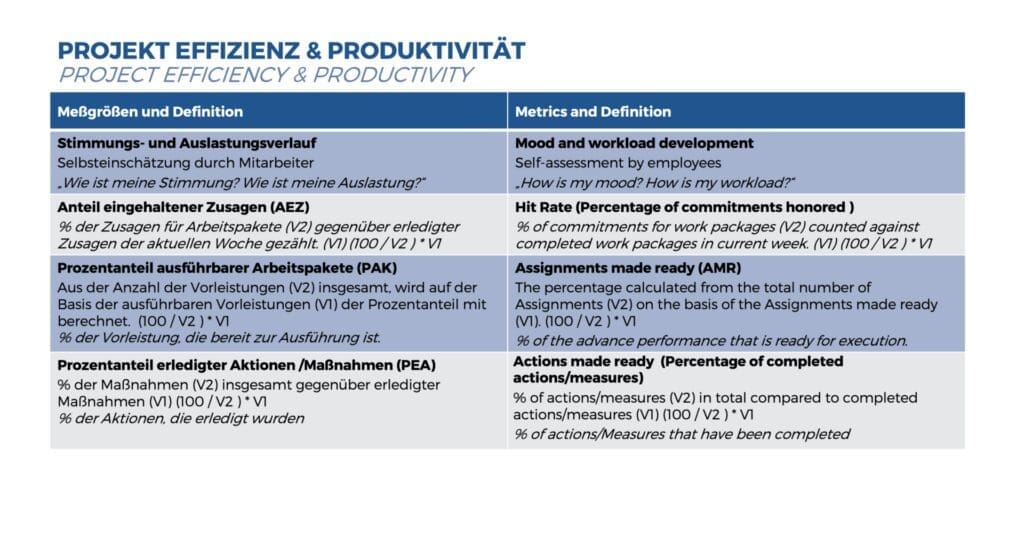
The mood and workload trend is based on employee self-assessment. Employees answer questions like “How is my mood?” and “How is my workload?”. This KPI provides insight into employee satisfaction and workload, which is important for resource planning and workplace climate.
The Hit-Rate or Percentage of Commitments Honored (PCH) measures the percentage of commitments for work packages that were met within a given week. This KPI helps evaluate the reliability and planning accuracy of the project team.
The Assignments made ready (AMR) indicates the percentage of preconditions that are ready for execution. This KPI helps monitor the efficiency of project preparation and readiness for implementation.
The Actions/measures made ready (Percentage of completed actions/measures) are the percentage of completed measures compared to the total planned measures. A high value shows that the project team is working effectively and implementing measures promptly.
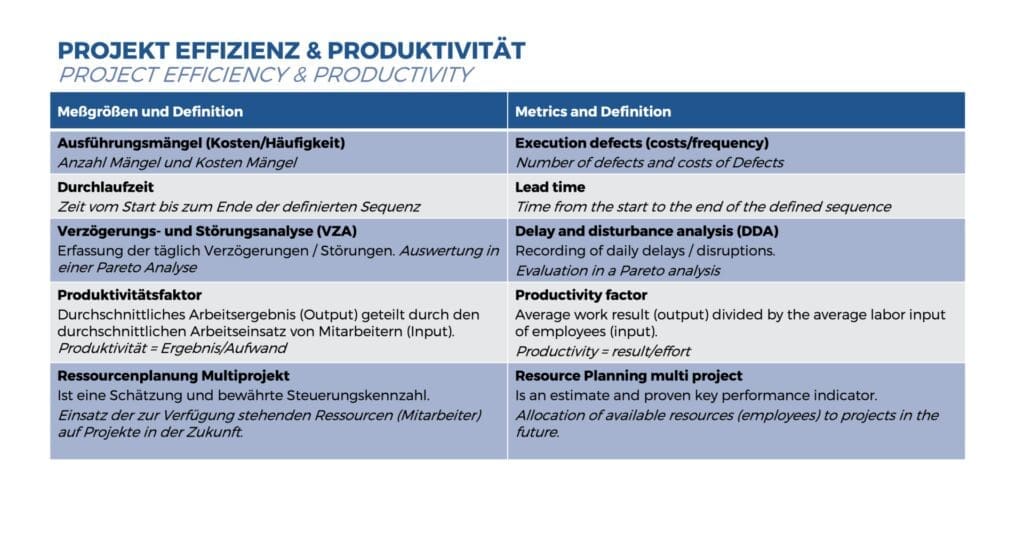
Execution Defects (Cost/Frequency). This KPI includes the number and cost of execution defects. It is important for identifying quality issues and understanding their financial impact.
Lead time measures the time from the start to the end of a defined sequence. It helps assess the efficiency of processes and identify bottlenecks.
The Delay and Disruption Analysis records daily delays and disruptions and analyzes them using a Pareto analysis. This KPI helps identify and address the main causes of delays.
The productivity factor is calculated as the average work output divided by the average work input of employees. This KPI shows how efficiently employees are working.
Multiproject Resource Planning. This KPI estimates and controls the deployment of available resources (employees) across multiple projects in the future. Effective resource planning is crucial for the successful execution of multiple projects simultaneously.
Conclusion
Using these metrics in a lean manufacturing environment allows you to increase the efficiency of your production processes, reduce costs and improve the quality of your products.
By regularly monitoring and analyzing these metrics, you can make informed decisions and drive continuous improvement in your business.
In particular, monitoring and analyzing KPI in project management is crucial to the success of a project. They make it possible to identify problems at an early stage, increase efficiency and improve quality. Through the targeted use of these KPI, projects can be carried out more successfully and smoothly.
Implement lean manufacturing and focus on the right metrics to ensure your operational success and increase your competitive advantage.

Contact us now!
We have more than 20 years of experience and deliver high quality consulting for your Agile, Lean or Digital Transformation.

