The Makigami method of process analysis
Behind Makigami (Japanese for “roll of paper”) lies a fast and simple methodto map business processes of any kind, analyse them and identify savings potential in terms of resources, interfaces, information flow, information technology and value creation.
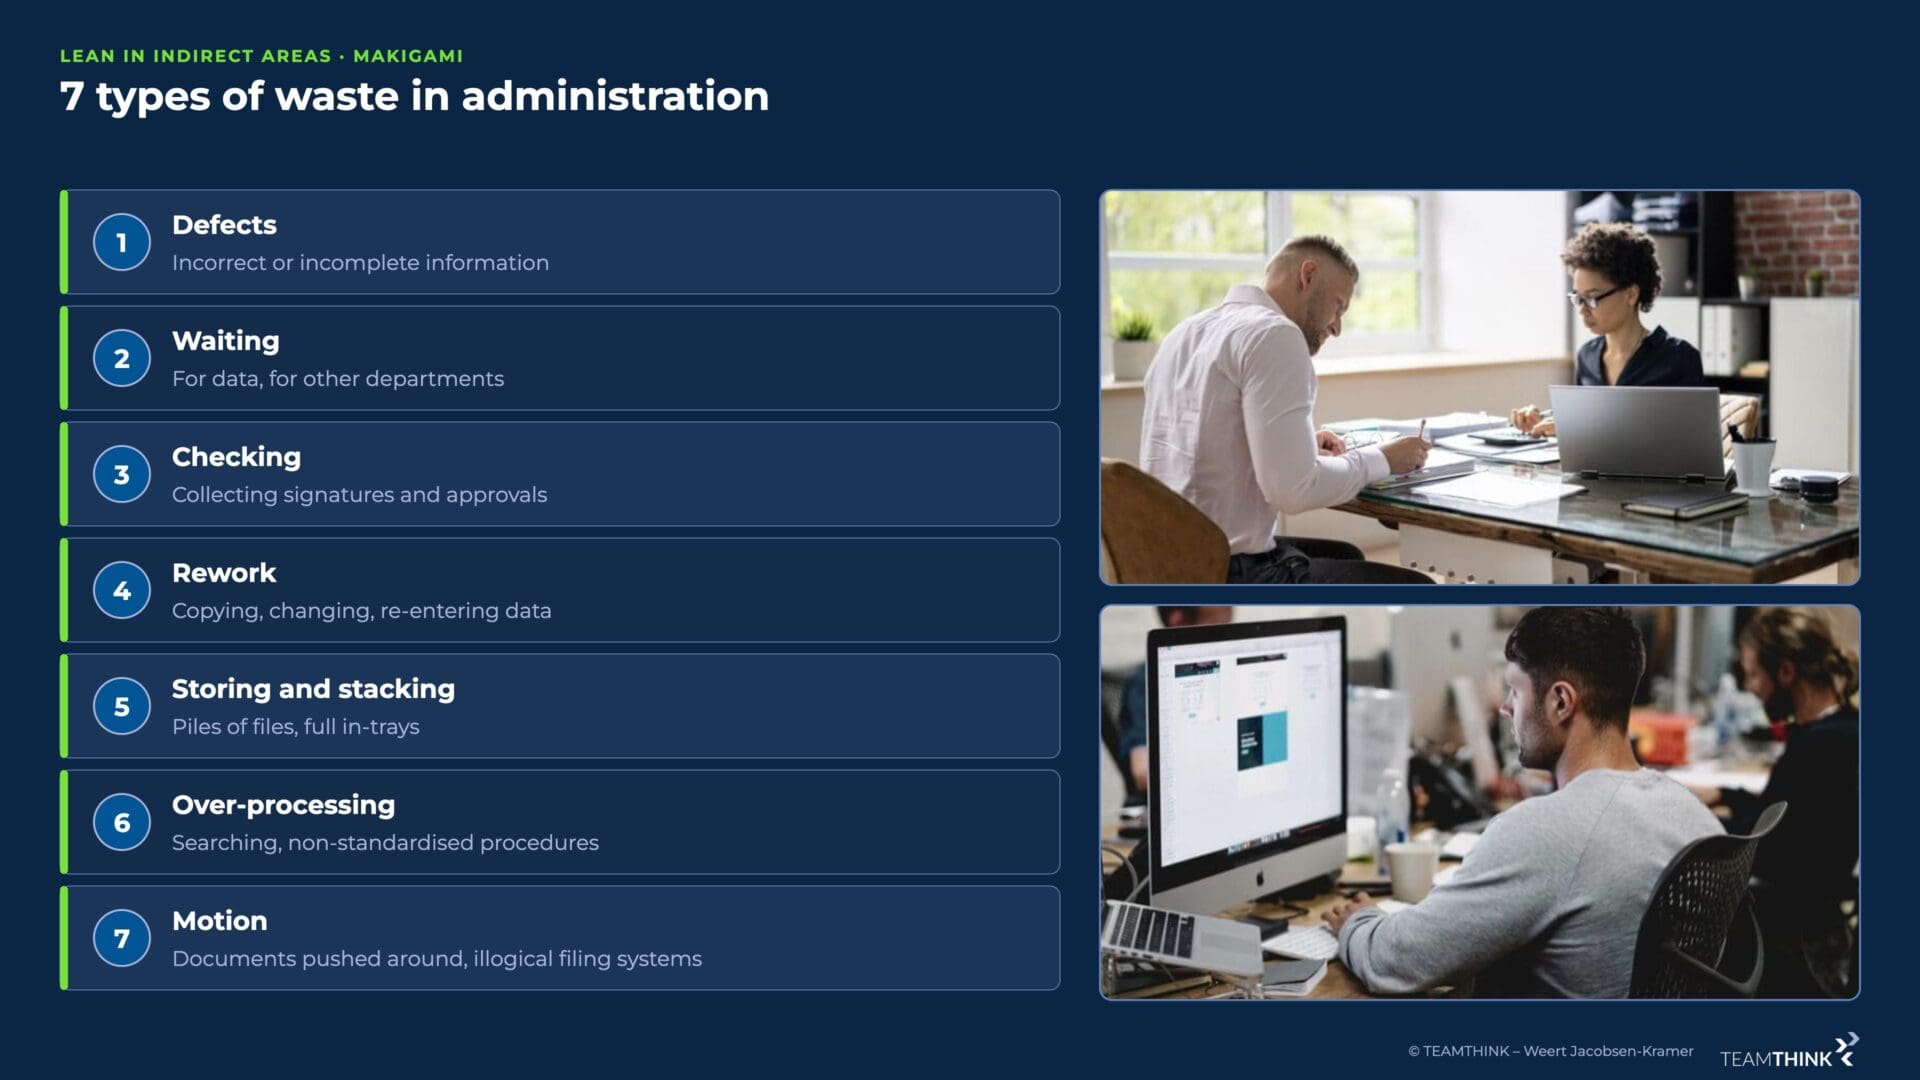
The method is particularly suited to eliminating losses in administrative areas, where processes are generally less transparent; for example, the classic seven types of waste can be made visible with Makigami.
Makigami is therefore a form of process mapping. The method shows and describes information flows and process steps as a flow chart . When recording a process, the Makigami method creates the transparency you need. The focus is on the process as a whole and on all related workflows.
For administrative processes, the analysis methods Makigami or process mapping are recommended. They present administrative product flows (= information) in a simple, easy-to-understand way. Thanks to its more detailed view, however, Makigami is more effective.
As with value stream mapping and value stream design, analysing the business process serves to develop a new target process with shorter lead times .
7 types of waste in administrative areas
The Makigami method is based on a way of thinking that is firmly anchored in lean management: distinguishing value creation from waste .
In administrative areas there is of course also waste, but it is not as easy to see as in direct areas.
The Makigami method helps to make exactly this waste visible.
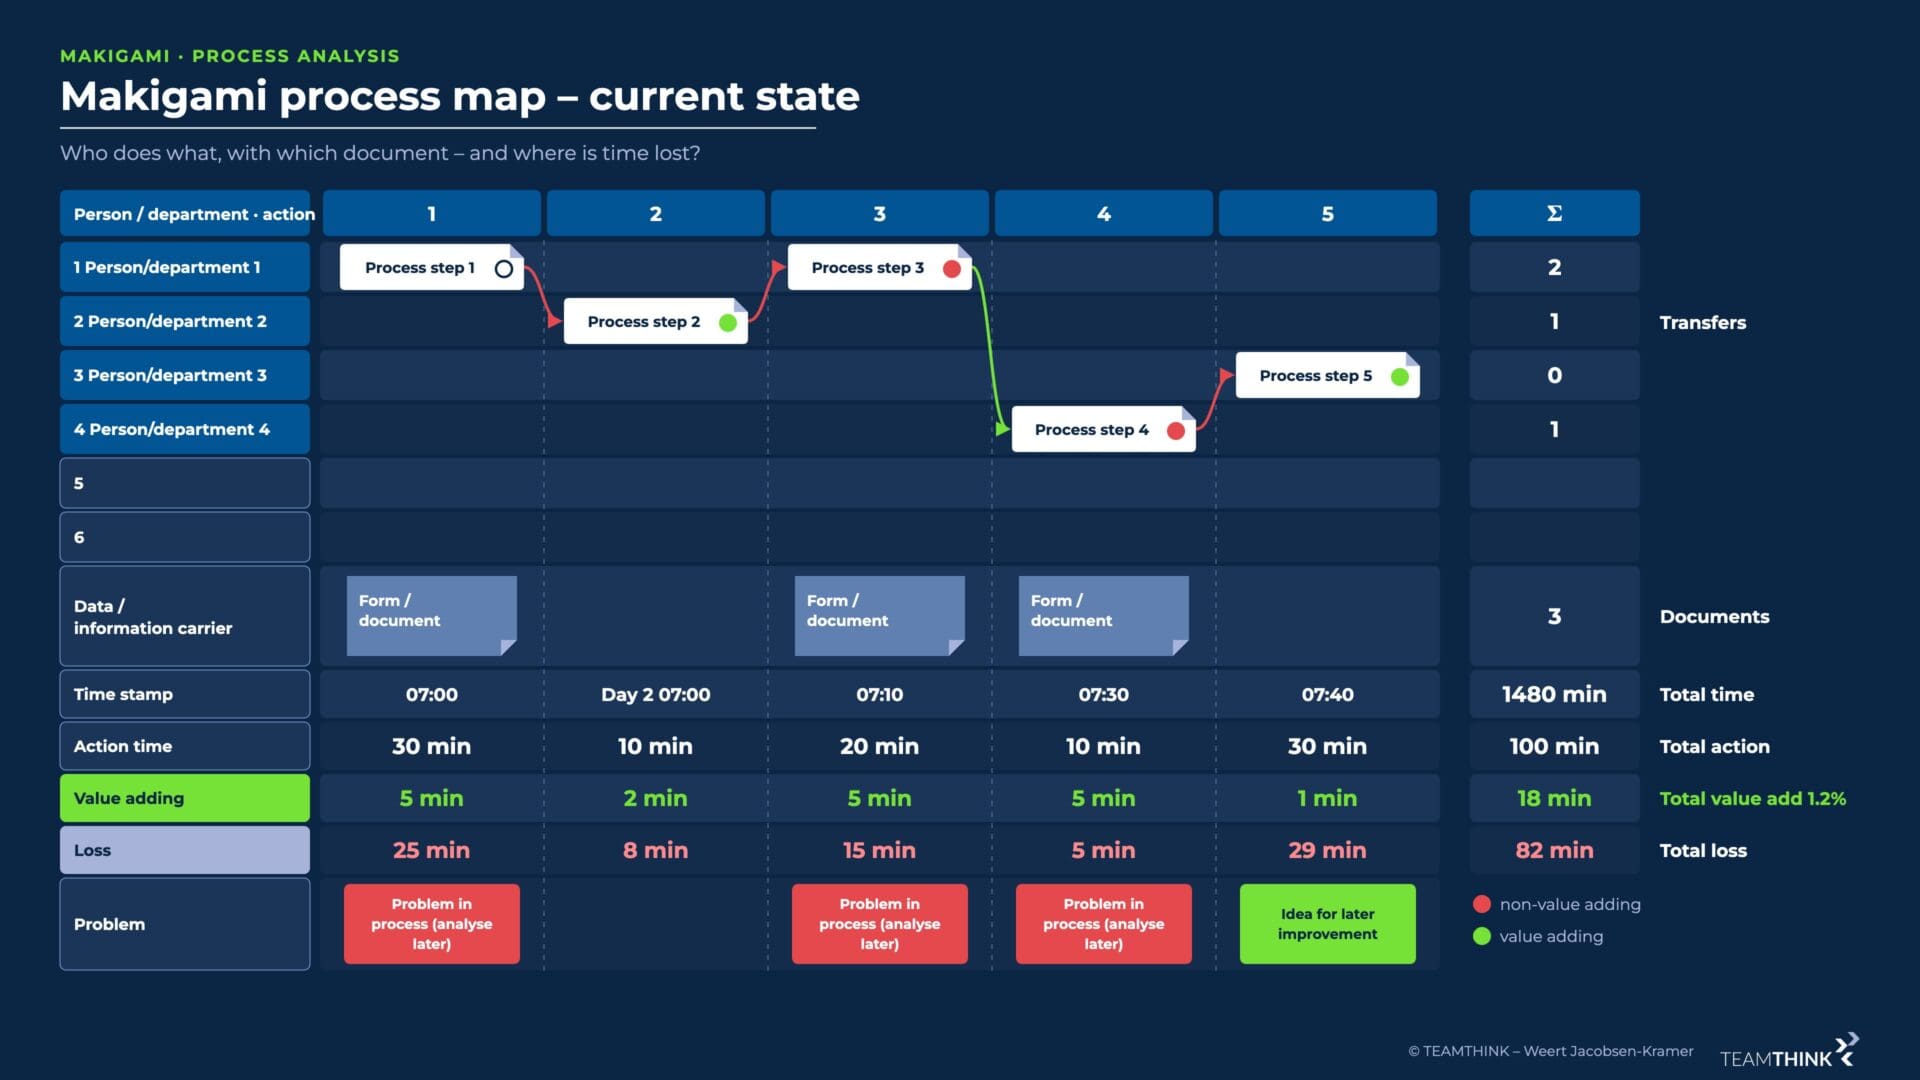
Phase 1:
Analysis of the current state and visualisation of the current situation.
In this phase you should ask the following questions: “Who does what? Which documents / means of communication are used? How long does the process step take? Which problems / waste occur during the process?”
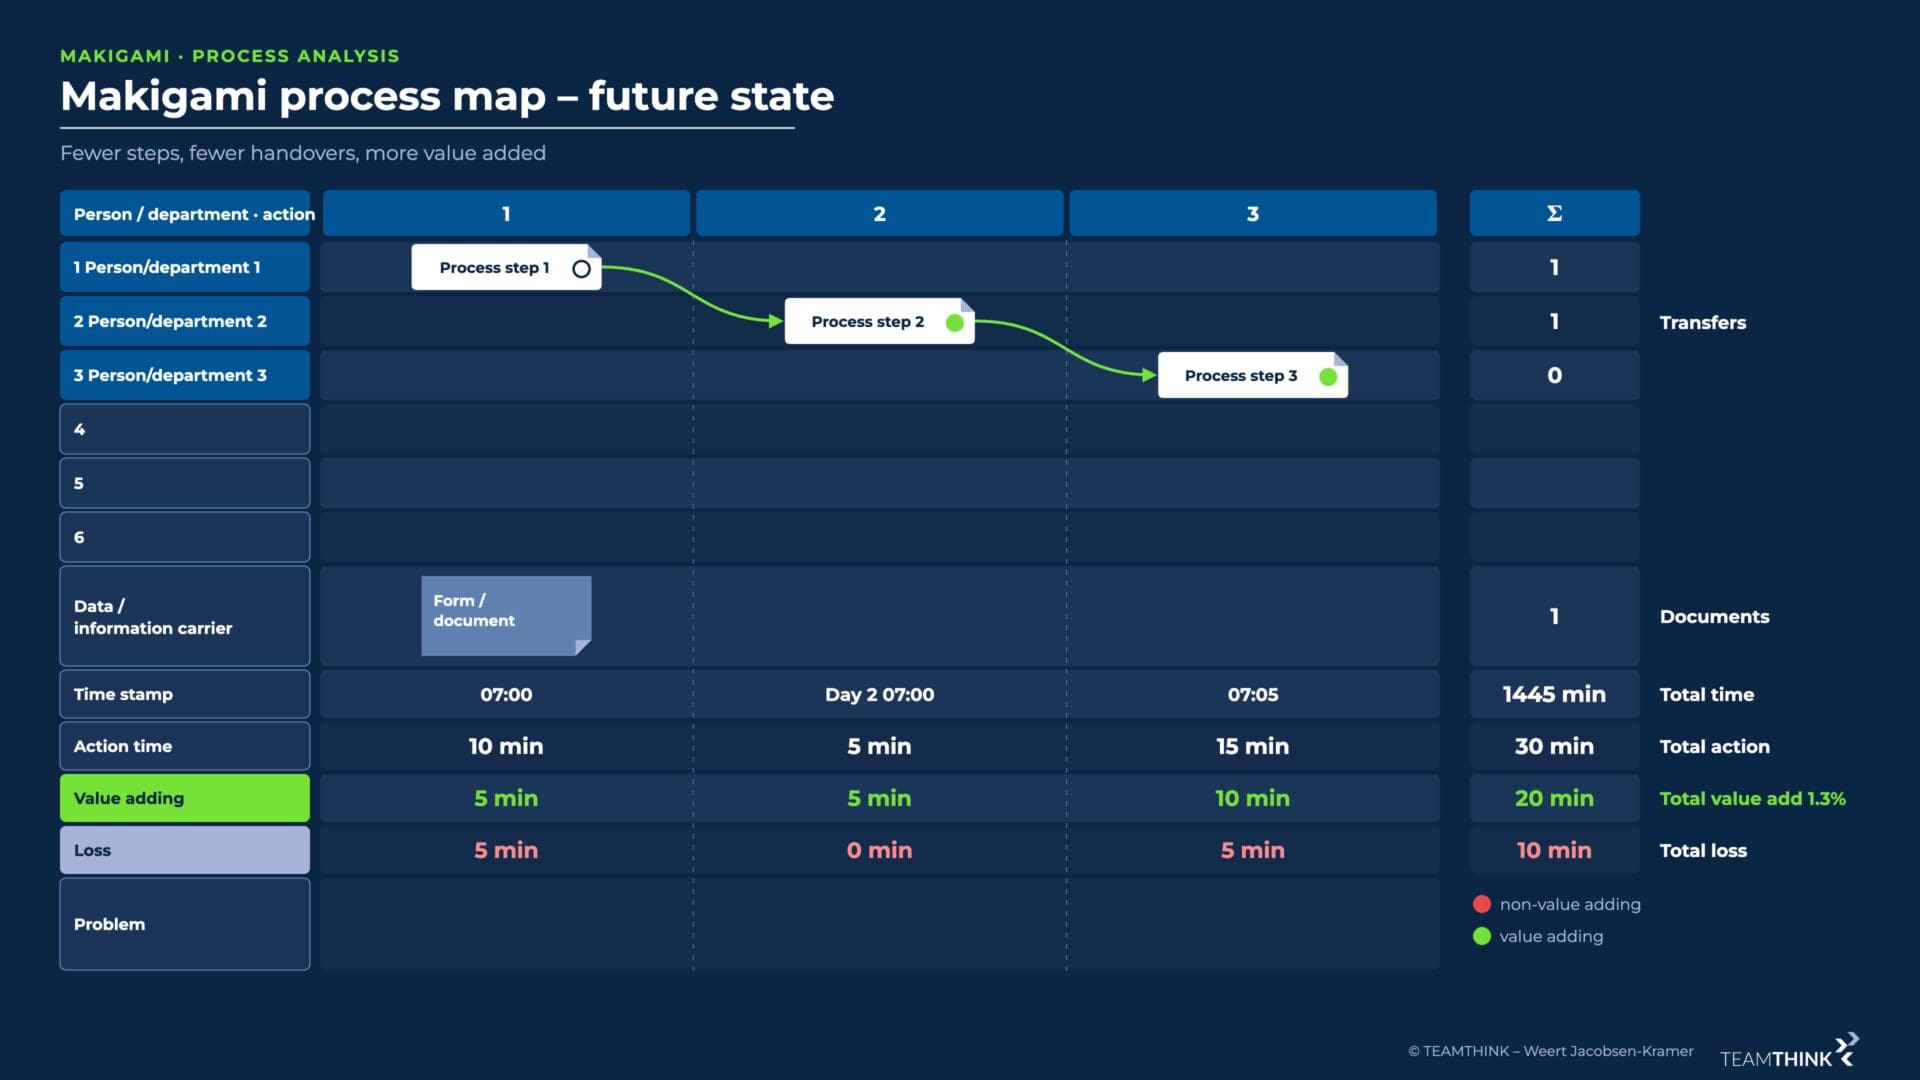
Phase 2:
Development of the target state and visualisation of the ideal state.
In this phase you must ask THE question: “How do I / we imagine the ideal process if I / we leave out all the external requirements on our process (at first glance)?” So first take a view that reflects your own wishes rather than reality.
Phase 3:
Implementation plan for reaching the target state and developing an improvement process.
In this phase you design a new process, taking into account influences such as your customers or internal conditions.
Makigami in detail: the content
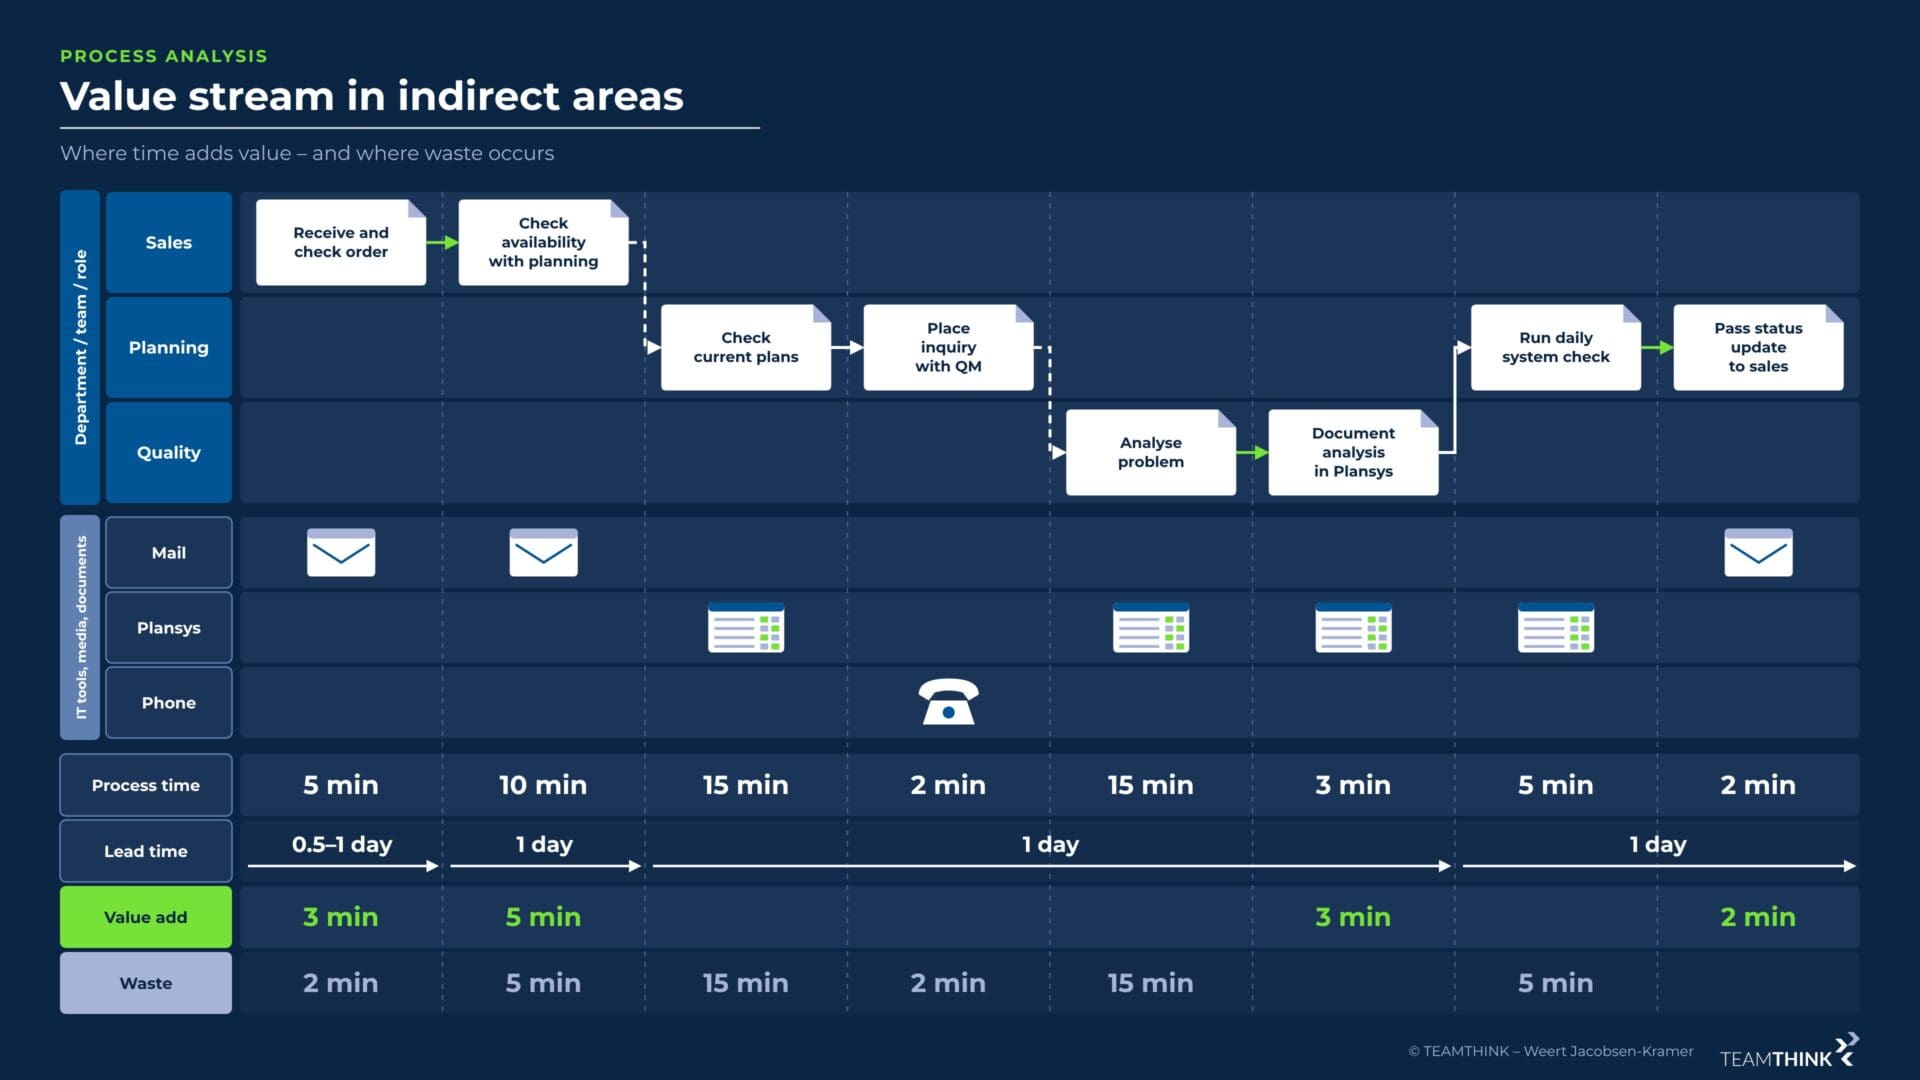
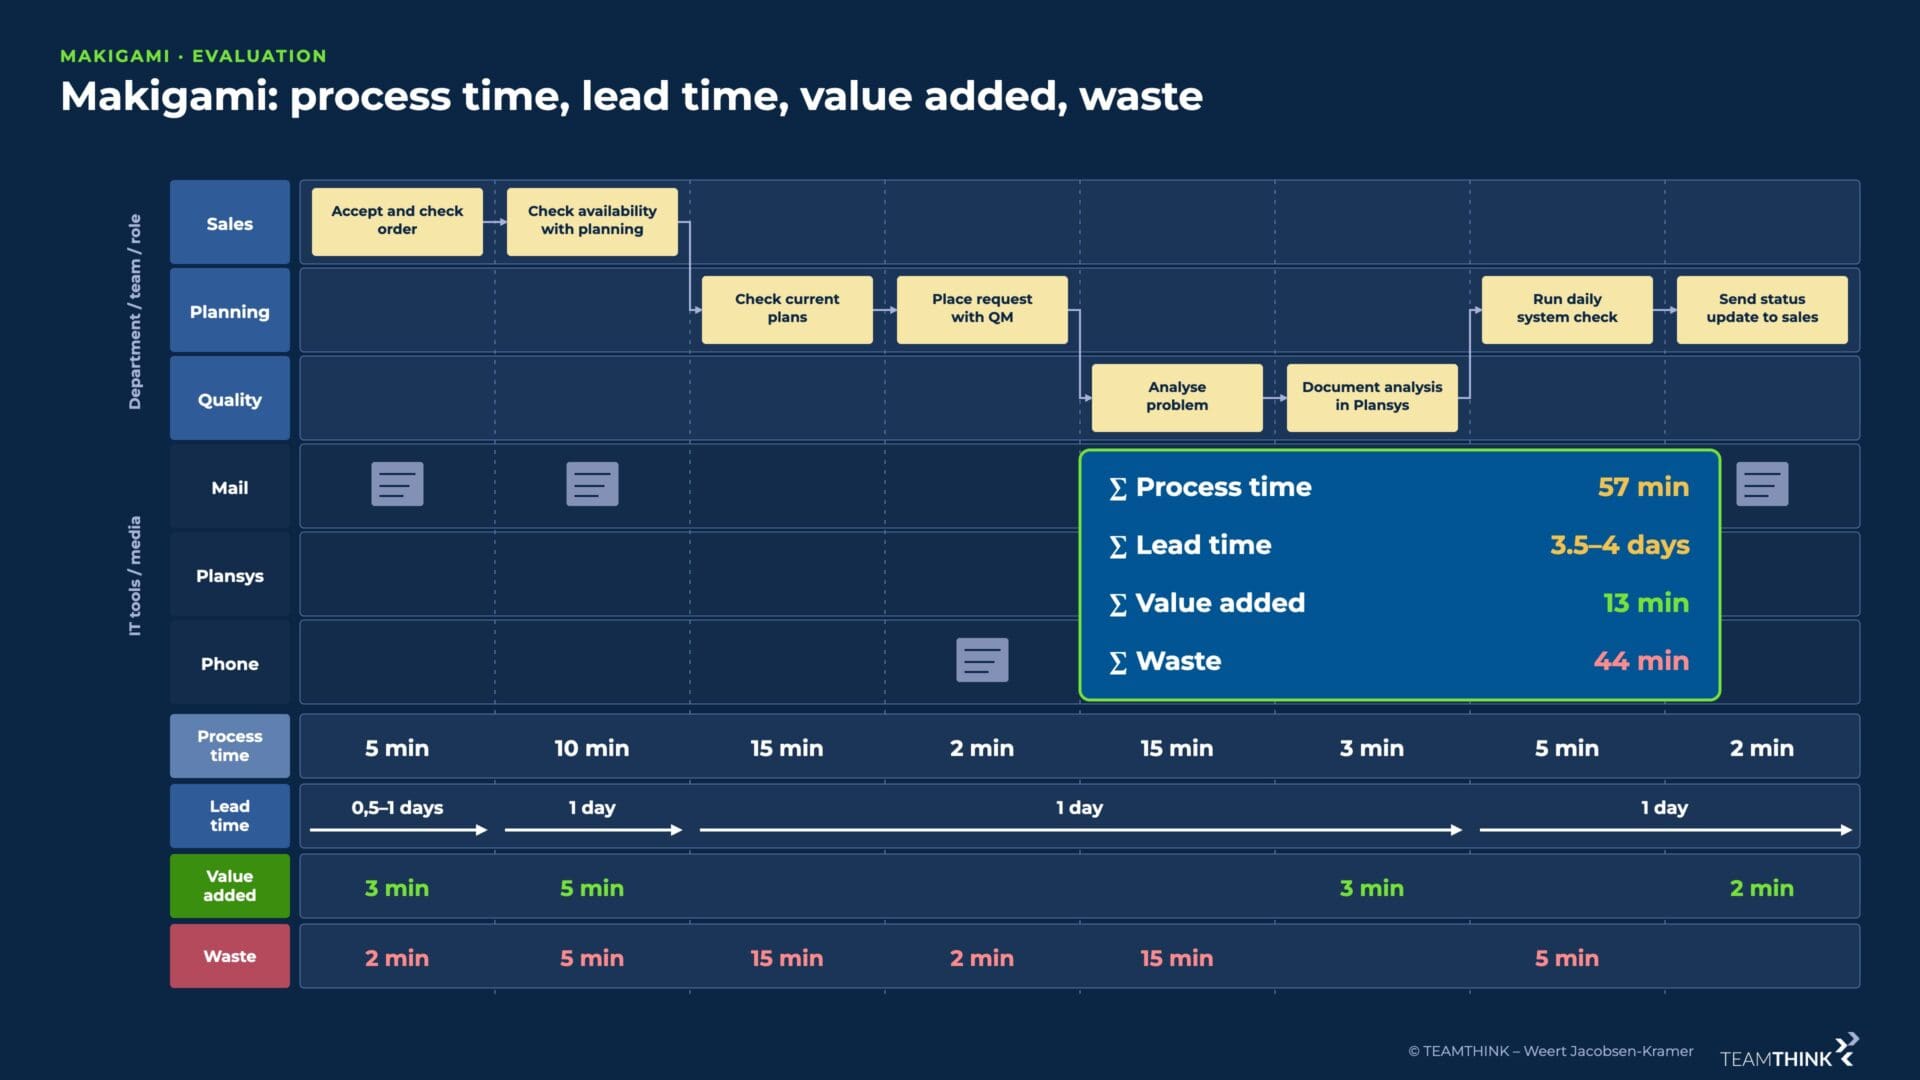
At its core, a Makigami has four areas:
- The activitiescarried out by the various parties/units involved.
- Documents, forms or other mediaused for communication between the parties/units involved.
- The time axis, which shows date and time, action times and value-adding times.
- The identified problems, which can be assigned to the activities in the individual process steps.
Makigami in detail: the procedure
- Define and describe which process is involved.
- Determine which people or departments are involved in this process.
- Work out each individual process step with the group. Identify and attach the required data carriers .
- Connect the individual process steps with red or green arrows . (Red = errors can occur here or information is missing. Green = no errors occur and all information is available.)
- Question each process step as to whether it adds value or not. Check against the following criteria: Does the process run better as a result? Does the customer benefit? Are there legal requirements to do it?
- Enter the time axis and include weekends, time after work, etc.
- Action times, i.e. the time in which an action actually takes place – work them out.
- Determine the value-adding time and question each point again as to how much value-adding time it really contains.
- Calculate the loss times: action time – value-adding time.
- 10. Count the transfers; a transfer occurs whenever information is passed on to another person or department.
- Determine the number of data carriers and the total times.
Summary
- Makigami is a simple method for recording processes and visualising the interplay between process and tools.
- Makigami can be used both for process analysis and for process design
- All functions and process steps involved in the process are shown in detail and assessed individually (information carrier, action time, value-adding time and loss time).
- Losses and waste are easier to identify.
- Lead time and process time reveal possible levers for optimisation through the focus on value creation and waste.
- Based on the current-state analysis, the process design and the implementation plan follow.
TEAMTHINK · Operational Excellence
Where are the biggest levers in your value streams?
Since 2000, TEAMTHINK and its team of experienced consultants have been implementing lean management in production, development and indirect areas. In our on-site Quick Check, we spend two days looking at your processes and discuss the results with your management.